Monday, March 23, 2015

Document Modeling Details with SAS Enterprise Miner, Easily and Consistently

One recent (6 months) trend in financial services is that regulators have asked companies to document details of models submitted for review. Challenge many companies face is that many modelers, experienced or not, are often not very well skilled in document-writing. Document style, structure, standards... vary by the modelers, by job roles, by departments and sheer language skills, among others. 

There is one facility inside SAS Enterprise Miner (EM), however, that is becoming very popular in relieving the condition. The feature, the usage of Score Node and Reporter Node together, has actually been within EM for a long time. 

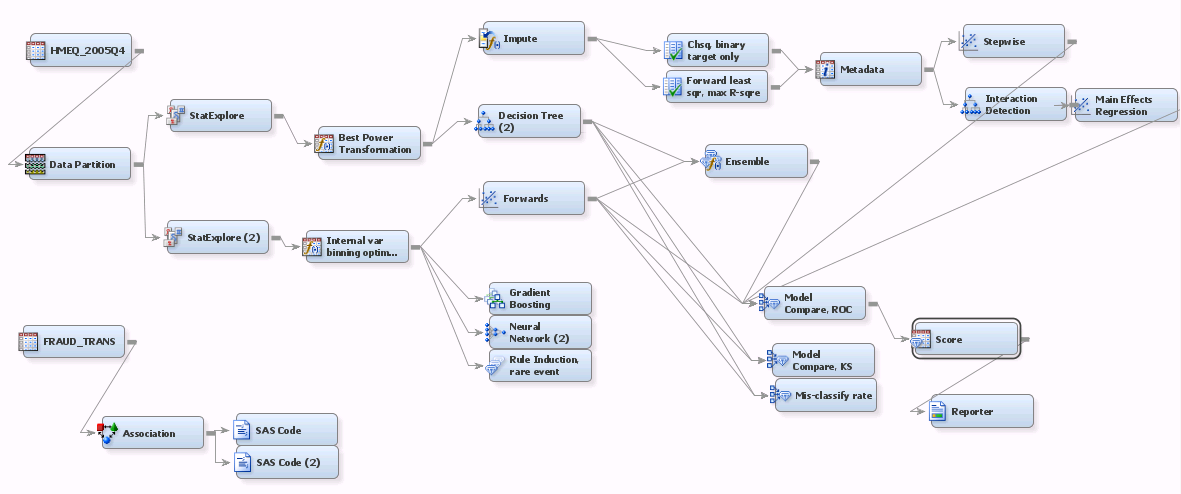
The picture below shows a moderately elaborate EM model project


The focus of this blog is the Score Node and Reporter Node, down right hand size. 
  1. EM's Score node is listed under Assess tool category. While it normally performs SCORING activities, the goal of the scoring exercise in this flow context is NOT towards score-production. On the contrary, scoring here is often towards validation (especially one-off scoring on ad hoc testing data files for the model), profiling and, YES, reporting. Reporting is where this regulatory task falls under. 
  2. You can link the Score to a model, or Model Comparison node as indicated by the picture above. 
  3. The picture below shows how to click through to get to the Score node

Once the Score node is connected to a preceding model or Model Comparison node, you can click on the Score node to activate the configuration panel as shown below


  1. For this reporting task, you can ignore details underneath Score Code Generation section. 
  2. The selections under Score Data are important, but that is if you have partitioned the model data set into validation or test data set or both. You typically have at least one of them for regulatory reporting exercise.
  3. You can test and see what are underneath the Train section.
Below shows how you click through to introduce the Reporter node to the flow. 


After you introduce the Reporter node and connect it to the Score node, the configuration panel, the core focus of this blog, appears upon clicking the node


  1. As of today, two Document formats are supported, PDF and RTF. RTF is a draft format for Word. Given that the direct output from EM Reporter node typically is used/perceived as a great starting pointing, subject to further editing using Word, not a final version, RTF format is more popular than PDF. Of course, if you prefer using Adobe for editing you can use PDF
  2. There are four styles available, Analysis, Journal, Listing and Statistical. +four Nodes options, Predecessor, Path, All and Summary. So far, the most popular combination among banks is Statistical /Path. 
  3. Selecting Show All does produce much more details. The resulting length of the document can easily exceed 200 pages.
  4. You can configure details under Summary Report Options to suit your case. It is very flexible. 
  5. This is how EM works: when you add nodes to build model, say, add EDA nodes like transformation and imputation, EM automatically records transformation and imputation, or 'actions'. When you connect a Score node, the Score node picks up all the details along the path (therefore the option Path or All Path), compile them into score code and flow code. The score code, in SAS data step, SAS programs (meaning procedures), (for some models) C, Java and PMML, is then available for production. When you add the Reporter node, EM will report on the process details.
To sum, the biggest advantage of using the Score +Reporter combination in EM is to provide one efficient, consistent starting model documentation template. Consistent because now if you ask the whole modeling team to report using the same set of configuration options, you get the same layout, granular details and content coverage. That is a big time saver. 

Thank you. 
From Wellesley, MA
Friday, January 9, 2015

Associative Rule Mining (ARM) using SAS In-Memory Statistics for Hadoop: A Start-up Example

In SAS Enterprise Miner, there are Market Basket Node and Association Node. In SAS In-Memory Statistics for Hadoop ("SASIMSH"), the statement ARM (Associative Rule Mining) covers most, if not all what the two nodes do inside Enterprise Miner. This post presents a start-up example on how to conduct ARM on SASIMSH. While it does not change much of  Market Basket Node and Association Node essentially do, you will see how fast SASIMSH can get the job done over 300 million rows of transaction over 12 months.

I focus on discussion of association based upon which, if you introduce temporal order of the transaction, you can easily extend /imagine into sequence.

The SASIMSH system used for this post is the same as the one used for my post dated 12/14/2014 "SAS High Performance Analytics and In-Memory Statistics for Hadoop: Two Genuine in-Memory Math Blades Working Together". Here are some info on the data set used.

The data set is simulated transaction data set consisting of 12 monthly transaction, 25 million transaction entries each, totaling 300 millions. The total size of the data set is ~125 GB. Below is monthly distribution.


T_weekday is how many transactions happen Sunday, Monday, Tuesday... Saturday. T_week counts how many transactions happen on week 1... week24....week52 on the year. These segment variables are created in case you want to break down your analysis.

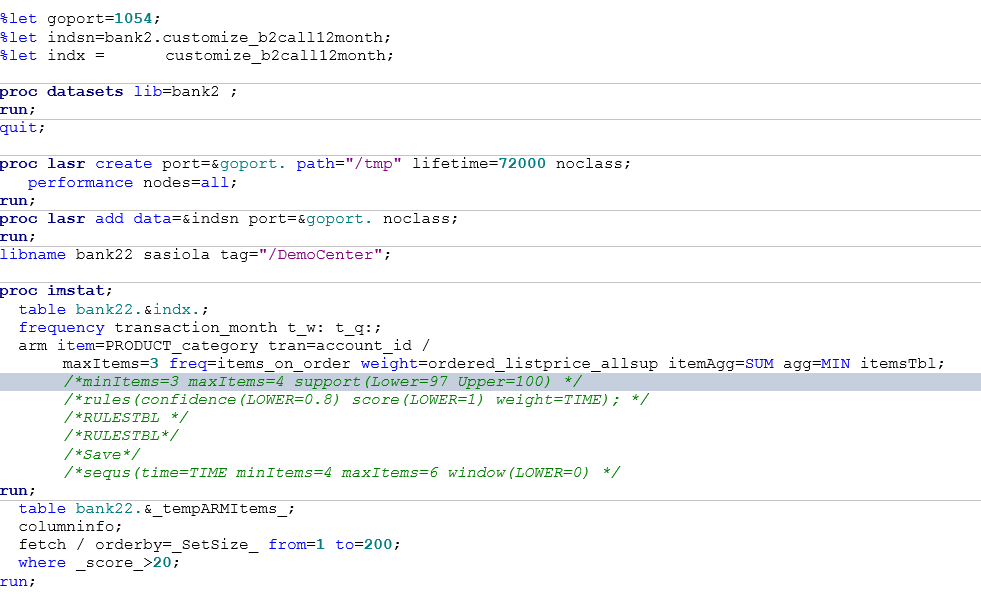
Below is main body of the ARM modeling code


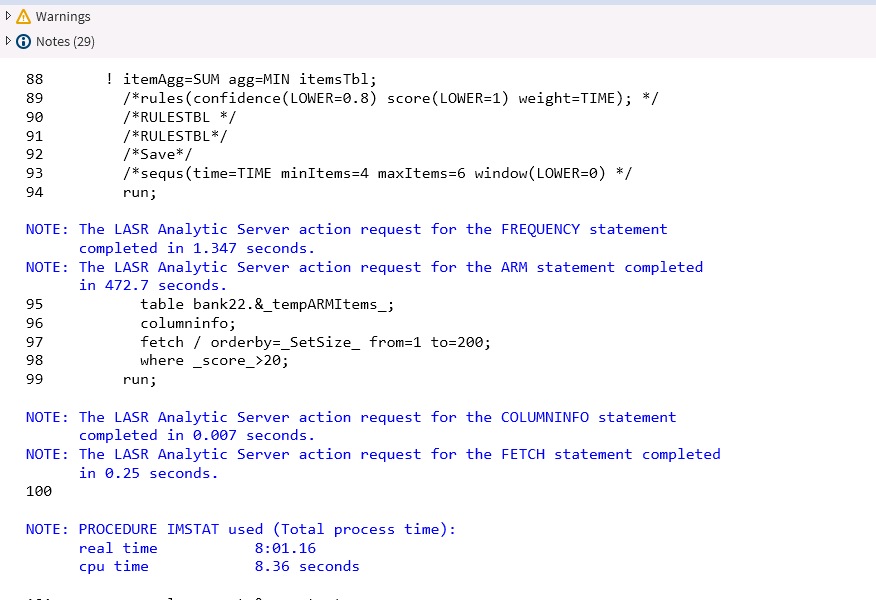
1. The two "Proc LASR" sections create LASR in-memory analytics process and load the analytics data set into it. The creation process took ~10 seconds and the loading process took ~15 seconds (see picture)


2. The Frequency statement simply profiles the variables the distributions of which I reported above.
3. The ARM statement  is where the core activities happen

  •  Item= is where you list the variable of product category. You have full control product hierarchy.
  •  Tran= is where you specify granular level of transaction data. There are ~9 million unique accounts for this exercise. If you choose to use a level that has, say, 260 unique level values (with proper corresponding product levels) you can easily turn the ARM facility into BI reporting tool, closer to IMSTAT's GROUPBY statement does.
  • You can use MAXITEMs= (and/or  MINITEMS) to customize item counts for compilation
  •  Freq = is simply order count of the item. While Freq = is more 'physical, accounting book weight'        (therefore less analytical, by definition), Weight= weighting is more analytical /intriguing. I used list price here, essentially compiling support  in terms of individual price importance, assuming away any differential price-item elasticity and a lot more. You can easily have a separate model to study this weight input alone, which is beyond the scope of this post. 
  •  The two aggregation options allow you to decide how item aggregation and ID aggregation should happen; if weight = is left blank, both aggregations ignore the aggregation= values you plug in and aggregate by default value of SUM, which is really to ADD UP. Ideally, one aggregation should use one weight variable. For now, if you specify weight=, the weigh variable is used for both. If you are really so 'weight' sensitive, you can run the aggregation one at a time, which does not  much more time and resources.
  •  The ITEMSTBL option asks  output of a temporary table to be created in-memory amid the flow for further actions during the in-memory process, the table system-reserved keyword  .&_tempARMItems_ refers to in the next step. This is different from what SAVE option generates. SAVE typically outputs table to Hadoop directory "when you are done".
  •  The list of options commented out in GREEN show that you can customize support output; you don't have to follow the same configurations when the ARM model was being fit above when generating rules or association scores.
4. Below is how some output looks like


  •  The _T_ table is the temporary table created. You can use PROMOTE statement to make it      permanent
  •  _SetSize_ simply tells number of products in the combinations.
  •  _Score_ is the result of your (double) aggregations. Since you can select one of 4 aggregation  
  •  options (SUM, MEAN, MIN, MAX) for either aggregation (ITEMAGG and AGG), you need to interpret the score according to your options.

5. This whole, while sounding cliche content wise, takes only ~8 minutes to finish over 300 million rows.


The gap between CPU time and real time is pretty large, but I care less since the overall is only 8 minutes.